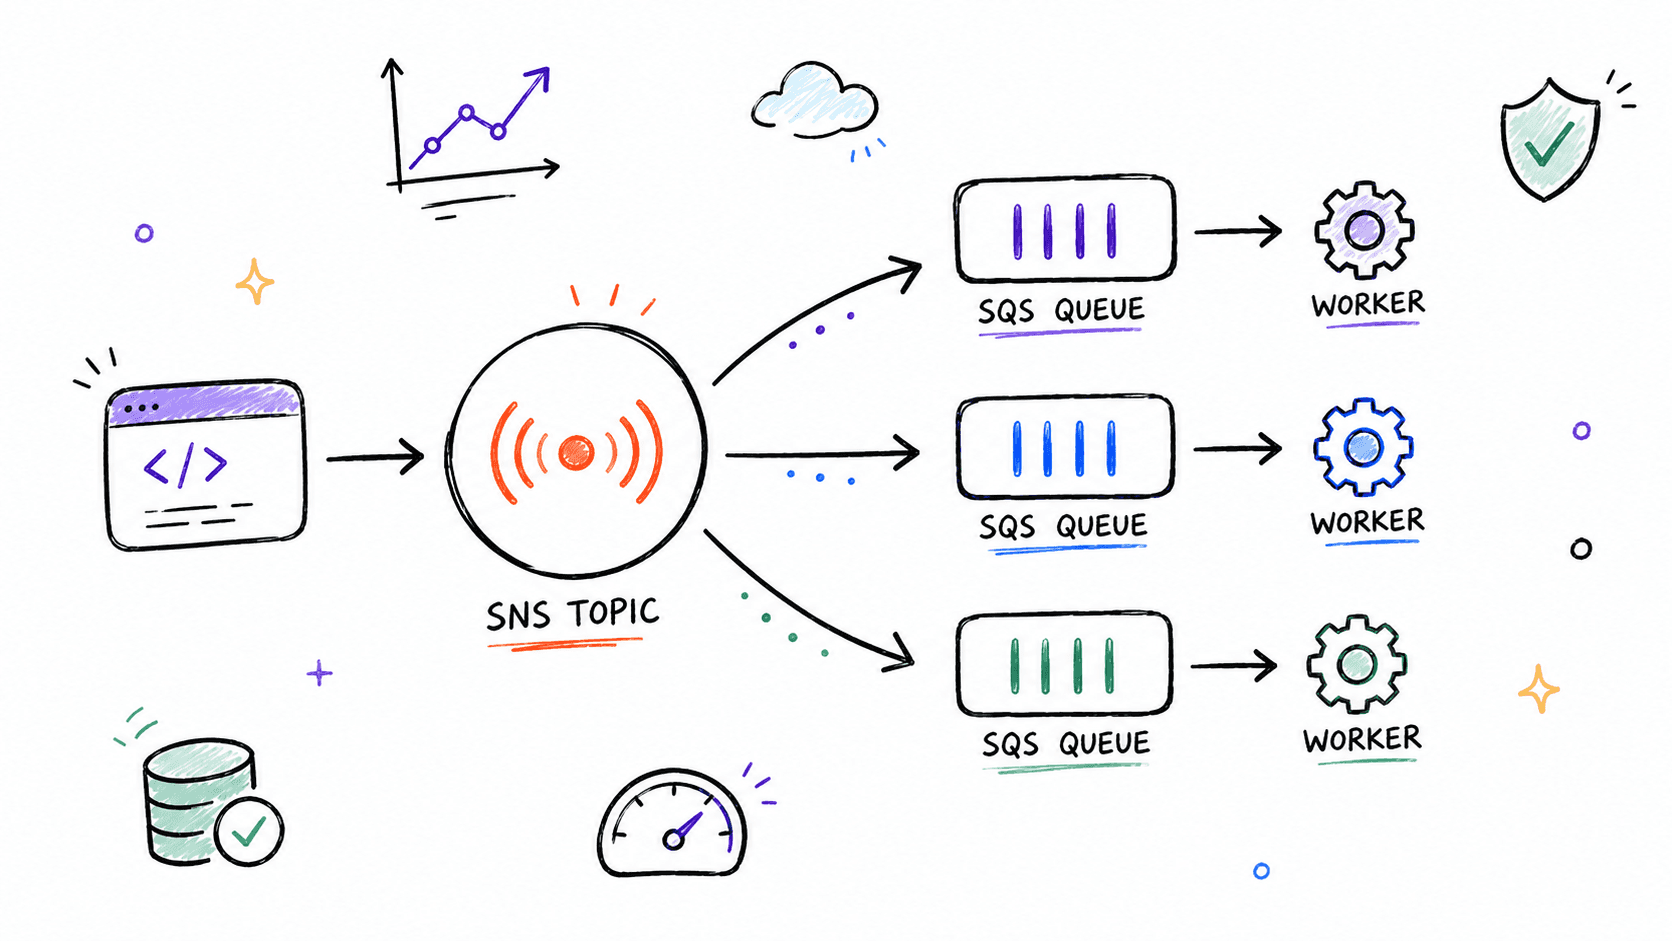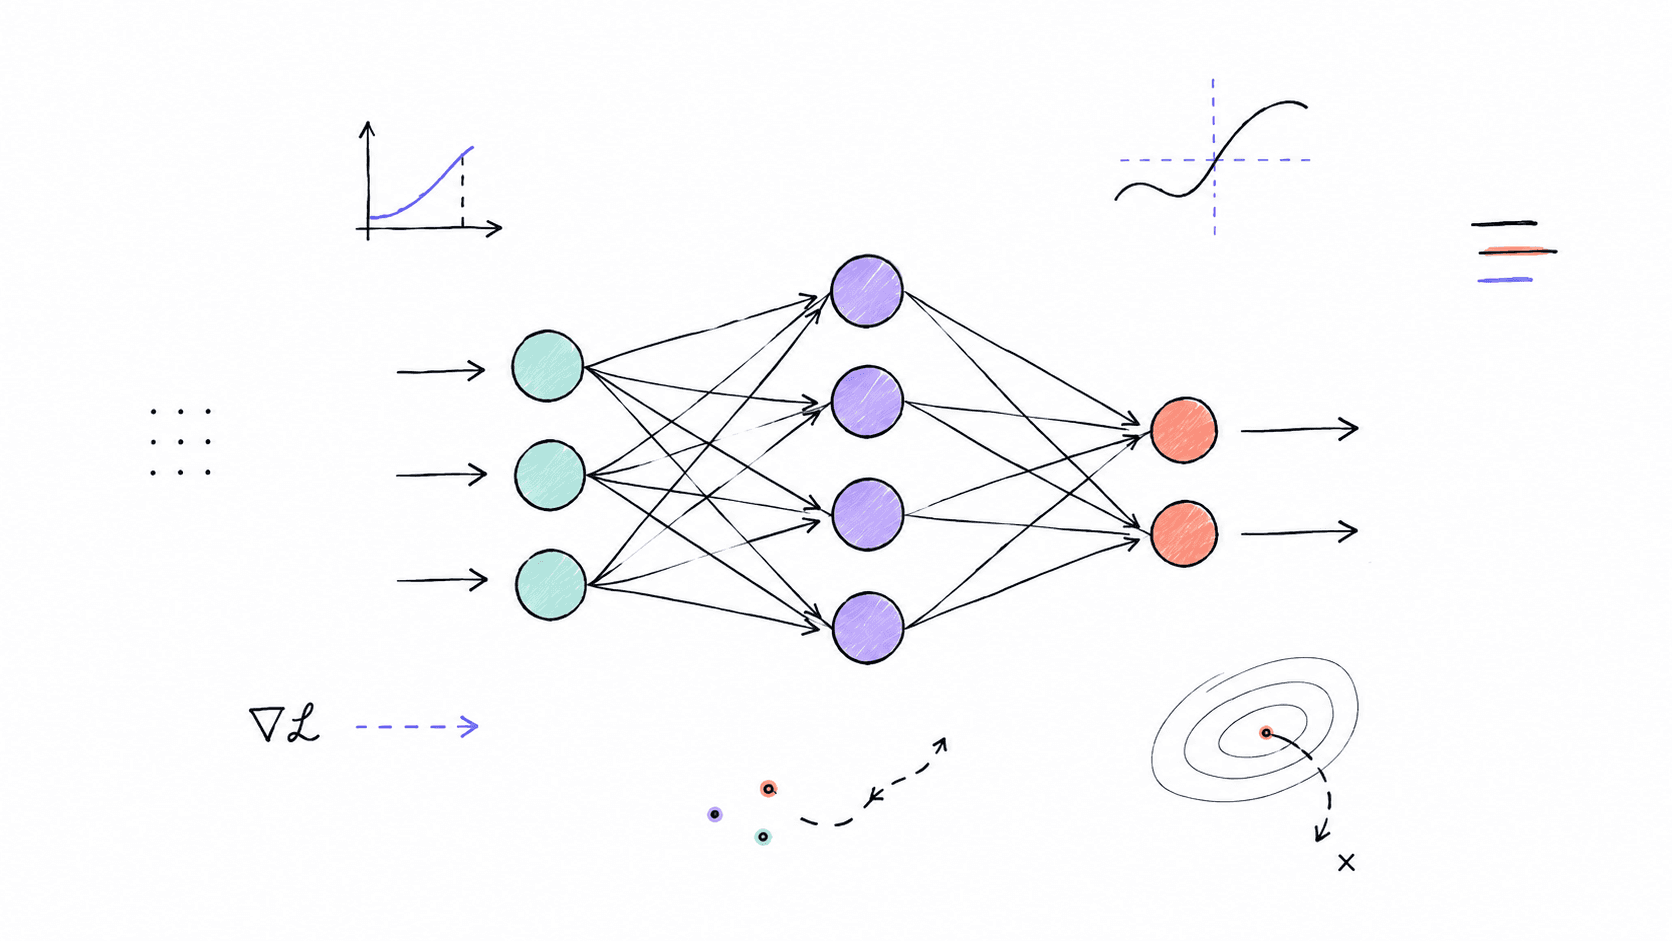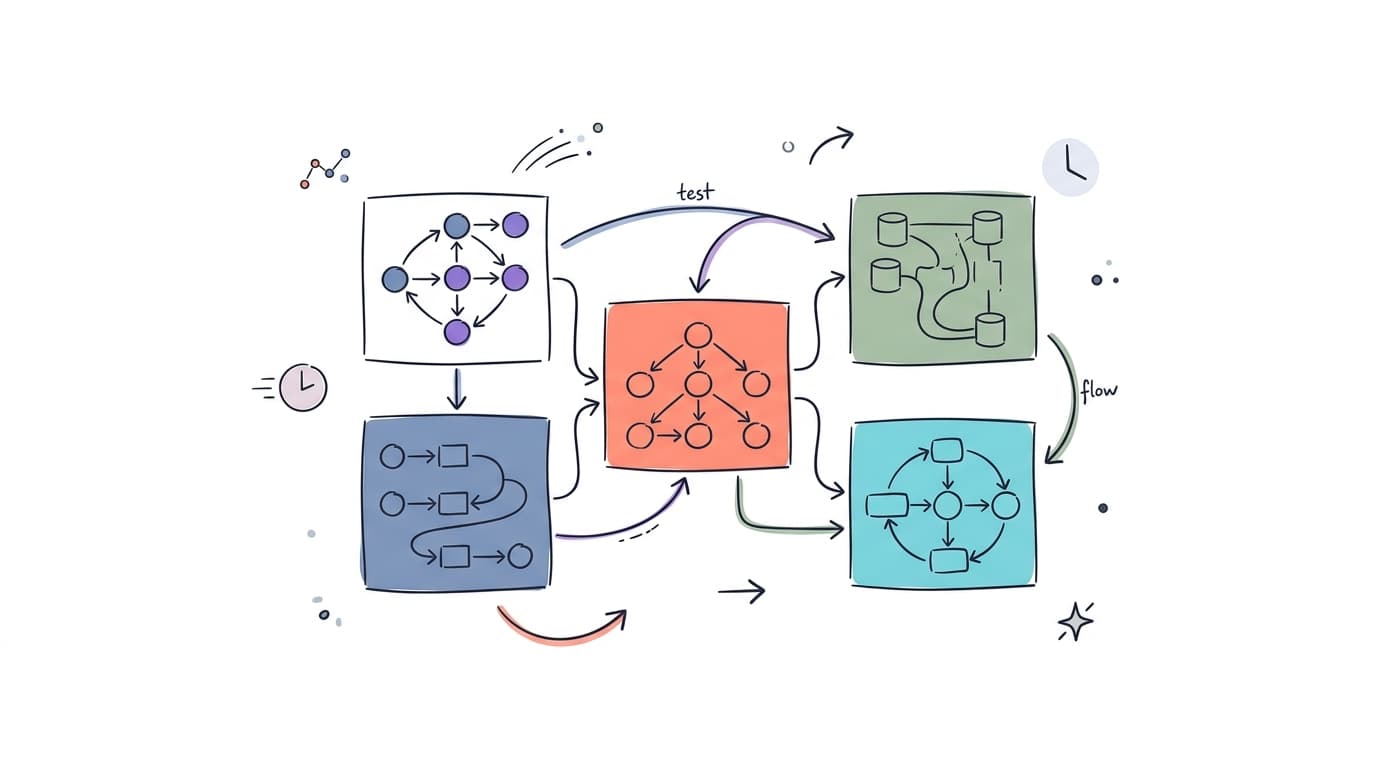
Visualizing software architecture, database schemas, sequence workflows, and concurrent execution pipelines requires expressive, maintainable diagramming engines. In PortfolioX, all technical articles leverage Mermaid.js rendered through our custom <MermaidDiagram> component with universal fullscreen expansion (<ExpansionModal>) and light/dark theme synchronization.
[!NOTE] Can we render rough, pencil-drawn Excalidraw-style diagrams in Mermaid? Yes! Absolutely. Mermaid 11 natively supports the
look: handDrawnrendering engine (powered by Rough.js), converting crisp vector geometry into imperfect, hand-drawn sketch lines. You can enable this look globally or per-diagram via frontmatter configuration (config: { look: handDrawn }). Below, we showcase 18 distinct diagram variations demonstrating custom colors, sketch modes, edge routing, and viewport scalability.
1. Hand-Drawn Excalidraw-Style System Topology
This architecture diagram uses the native look: handDrawn configuration, rendering nodes, cylindrical database containers, and curved connecting arrows with authentic hand-drawn pencil linework.
2. Hand-Drawn Sketch Deployment Sequence
A sequence diagram utilizing look: handDrawn to visualize an automated CI/CD static site compilation and edge asset distribution workflow with rough sketch lifelines.
3. Microservice Topology & Colored Subgraphs
This flowchart models a distributed AI workspace architecture utilizing classDef color themes and subgraph background boundary styling.
4. Relational Database Entity Relationship (ER) Schema
An Entity-Relationship (erDiagram) modeling a multi-tenant voice AI workspace with users, document chunks, vector embeddings, and session transcripts.
5. WebRTC LiveKit Voice Agent Sequence Flow
A sequence diagram (sequenceDiagram) tracing the low-latency real-time voice pipeline between client audio capture, LiveKit Cloud WebRTC, Qdrant vector retrieval, and LLM inference.
6. Real-Time Session Finite State Machine (FSM)
A state diagram (stateDiagram-v2) illustrating the lifecycle states of a WebRTC voice assistant session, including error recovery and cleanup.
7. Object-Oriented Class Architecture
A class diagram (classDiagram) detailing the software interface abstractions powering our modular audio streaming and vector search subsystems.
8. Engineering Priority & Impact vs. Effort Quadrant Matrix
A 2x2 quadrant matrix (quadrantChart) mapping technical initiatives across Effort (X-axis) and Impact (Y-axis) to guide architectural roadmap prioritizations.
9. User Experience & Interaction Journey Map
A user journey diagram (journey) charting developer interactions from initial landing page discovery to executing WebRTC voice calls and downloading session notes.
10. Platform Evolution & Multi-Year Architecture Timeline
A chronological timeline (timeline) highlighting major architectural milestones across the platform lifecycle.
11. Engineering Roadmap & Release Schedule
A Gantt chart (gantt) modeling quarterly milestones for voice AI agent RAG optimizations and Next.js App Router integrations.
12. System Architecture Feature Mindmap
A hierarchical mindmap (mindmap) decomposing system features into modular engineering domains.
13. Git Trunk-Based Branching & Deployment Flow
A gitGraph illustrating feature development, hotfixes, and release tagging on main branch.
14. High-Concurrency Event Queue Architecture
A left-to-right (graph LR) micro-architecture diagram with distinct colored styling for worker nodes, event buses, and dead-letter queues.
15. System Infrastructure Cost Distribution
A pie chart (pie) visualizing infrastructure compute and storage allocation across cloud microservices.
16. High-Throughput Ingress & Data Stream Distribution
A Sankey flow diagram (sankey-beta) visualizing volume distribution from edge ingress into downstream processing pipelines.
17. C4 Enterprise System Context Architecture
A C4 Model system context diagram (C4Context) illustrating high-level organizational actor relationships and external cloud service dependencies.
18. Security & Latency Requirement Verification Matrix
A SysML-style requirement diagram (requirementDiagram) demonstrating automated verification traceability for real-time audio latency benchmarks.
Part II: Editorial Architectural Design System
Beyond Mermaid.js, PortfolioX incorporates a publication-grade Editorial Diagram Design System. Built around strict typography hierarchies (Instrument Serif headers, Geist sans node names, and Geist Mono technical ports), semantic token roles, and zero-build SVG execution, these diagrams visualize complex topologies without visual clutter or generic auto-layout constraints.
19. Secure Paved Road Architecture
This diagram illustrates a strict zero-trust boundary model: untrusted client ingress is routed through an authenticated API Gateway and ephemeral sandboxed agent enclave before reaching protected vector indexes and GPU model pools.
20. Fan-In Queue & Bottleneck Data Flow Pipeline
A high-throughput asynchronous event distribution pipeline where multiple distributed producers (Voice streams, Telemetry, State logs) fan into a partitioned Kafka buffer queue with auto-scaling downstream consumer workers.
21. Medallion Lakehouse Tier Storage Architecture
A multi-tier data storage lifecycle modeling progressive data refinement from raw append-only Bronze events to schema-conformed Silver Parquet tables and curated Gold vector embeddings.
22. Reinforcing Flywheel Loop & State Accumulator Hub
A self-reinforcing continuous intelligence cycle where user conversations distill facts into a central Knowledge Graph hub, directly improving nightly fine-tuning weights and subsequent inference precision.
23. Multi-Criteria Spider / Radar Evaluation Matrix
A 5-axis quantitative evaluation spider chart comparing the PortfolioX local AI engine against a traditional REST baseline across latency, recall, cost, throughput, and tool accuracy.
24. Multi-Tier Compensating Security Layers
A defense-in-depth security model showing layered compensating controls from Edge WAF and semantic firewalls to ephemeral gVisor container isolation and output token redaction.
25. Physical Database Schema (Column Types & Foreign Keys)
A relational database ER schema detailing SQL types, primary keys (PK), column-level foreign key relations (FK), and specialized HNSW cosine vector index definitions.
26. Wardley Map: Value Chain vs. Evolution
A strategic Wardley map positioning user experience, custom agent orchestration, third-party model APIs, and commodity GPU infrastructure across the Genesis-to-Commodity evolution spectrum.
27. Hierarchical AST & Compiler Decision Tree
A multi-level syntax decomposition tree illustrating lexer scanning, token trie lookup, parser semantic validation, scope symbol tables, and bytecode code generation.
28. Complex Directed Acyclic Dependency Graph (DAG)
A complex dependency graph modeling multi-layered task dependencies, shared resource fan-in, and async execution order across microservices and vector indices.
29. Draw.io Redraw: Kubernetes Cloud Mesh Topology
An architectural redraw transforming an unstructured Draw.io .drawio XML schema into a clean, branded editorial topology featuring VPC ingress, GPU inference clusters, and persistent state databases.
29B. Draw.io Ingestion: Multi-Region VPC Transit Gateway Mesh
An editorial redraw of an enterprise multi-region AWS network diagram originally authored in Draw.io. Groups private compute subnets across US and EU zones connected through a central AWS Transit Gateway with zero public egress.
29C. Draw.io Ingestion: PCI-DSS Payment Settlement Enclave
A Draw.io redraw of a high-security banking checkout flow separating untrusted browser requests, an AWS CloudHSM tokenizer enclave with AES-256 GCM vaulting, and external Visa/Mastercard settlement APIs.
29D. Draw.io Ingestion: Enterprise Lakehouse & Spark Streaming Core
A Draw.io redraw of a high-throughput enterprise data pipeline ingesting raw CDC PostgreSQL streams into an S3 landing zone, transformed by EMR Spark executors into Snowflake and Qdrant hybrid vector marts.
30. High-Level Enterprise Data & AI Platform Overview
An end-to-end data platform architecture combining top phase chevrons, Kubernetes cluster boundaries, Temporal/Airflow orchestration bars, Iceberg lakehouses, sandboxed AI agent execution enclaves, and bottom zero-trust security footers.
31. Modern AI Data Platform Integration Topology
An end-to-end integration topology detailing real-time stream processing with Apache Flink, ACID Iceberg table commits, Kafka event streaming, and downstream low-latency serving to Qdrant and voice AI workers.
32. Programmatic Hand-Drawn Voice AI Pipeline (roughjs)
A hand-drawn real-time voice streaming pipeline rendered programmatically via Rough.js (rough.svg()). Features organic monoline strokes, sketchy hatching, audio waveform curves, and a focal LLM agent core with sub-100ms time-to-first-token (TTFT).
33. Cognitive Agent Memory & Vector RAG Hub (roughjs)
A multi-tier hand-drawn cognitive architecture demonstrating user intent ingestion, working episodic memory buffers, and a central Qdrant HNSW vector cluster feeding into a reasoning and tool synthesis loop.
34. Distributed Raft Consensus & Quorum Cluster (roughjs)
A hand-drawn distributed consensus cluster illustrating leader election, follower heartbeat replication ACKs, and network split-brain isolation barriers with cross-hatched node shading.
35. MicroVM Sandbox Isolation & Security Boundary (roughjs)
A hand-drawn defense-in-depth model demonstrating how untrusted dynamic user code execution is constrained within an ephemeral gVisor / Firecracker microVM container, blocking direct kernel syscalls.
Conclusion & Design Insights
- Triple Engine Architectural Harmony: PortfolioX now supports a unified Triple Diagram System:
- Mermaid 11 Engine: Declarative text-based diagrams and state machines.
- Editorial Diagram Design Studio: Branded, publication-grade parametric SVG schematics.
- Rough.js Hand-Drawn Studio: Programmatic, organic hand-drawn diagrams with sketch hatching, wavy curves, and Excalidraw aesthetics.
- Interactive Zoom, Pan & Drag: All diagram variants support fluid mouse wheel zoom, click-to-zoom focal magnification (2x), pan dragging inside the unified
<ExpansionModal>, and standalone SVG exports. - Dark & Light Mode Harmony: Every component adapts to system theme transitions via
next-themes, ensuring crisp contrast, readable typography, and high-fidelity rendering in any environment.
36. External Tooling & Reference Links
Hover over any of the reference links below to inspect live, cursor-following OpenGraph previews:
-
Diagramming & Rendering Engines:
- Mermaid.js Official Documentation — High-velocity declarative diagramming syntax.
- Rough.js Hand-Drawn Graphics Engine — The lightweight 2D sketch graphics engine powering hand-drawn SVG and Canvas rendering.
- Draw.io Diagramming Platform — Enterprise vector whiteboard and cloud architecture layout tool.
- Excalidraw Virtual Whiteboard — Collaborative virtual hand-drawn sketch tool.
-
Infrastructure & Distributed Systems:
- LiveKit WebRTC & Voice AI — Real-time audio transport and edge AI agent workers.
- Qdrant Vector Database — High-dimensional HNSW vector index for RAG and semantic retrieval.
- Apache Kafka Event Hub — High-throughput distributed event streaming platform.
- Apache Flink Stream Processing — Stateful real-time stream computations at scale.